
Dear copiers and followers,
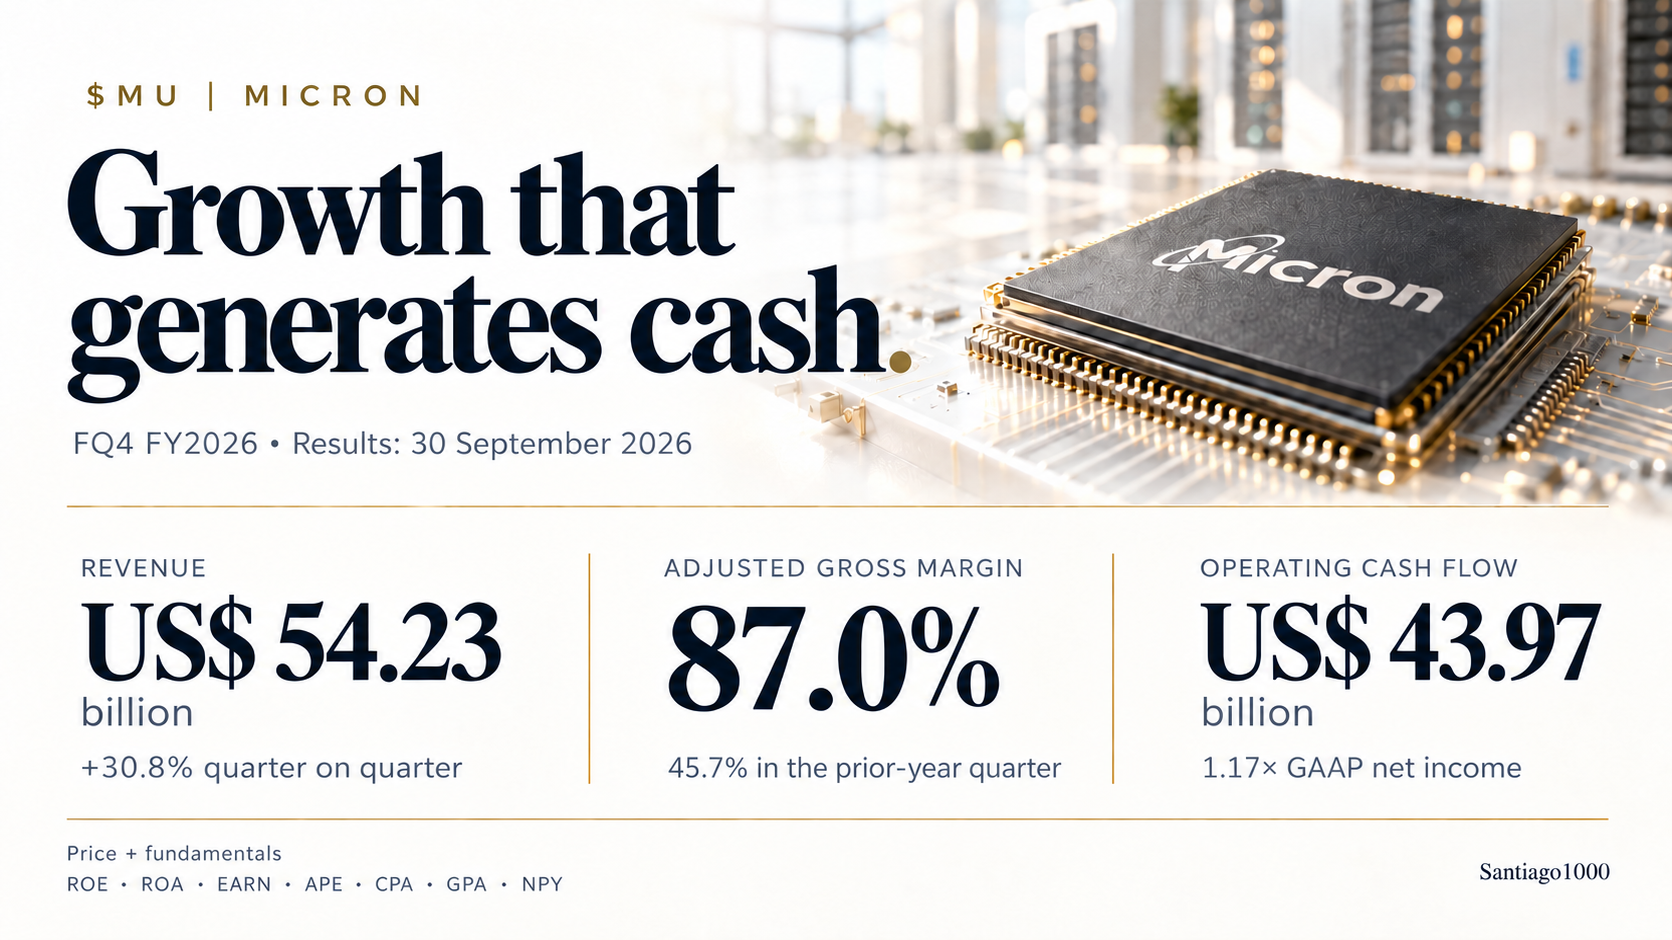
The latest Micron earnings ($MU), for fiscal Q4 2026 — the quarter ended 3 September and reported on 30 September — showed revenue of US$54.23 billion: up 379% year on year and 30.8% quarter on quarter.
What matters most in my analysis is the combination of growth, profitability and cash generation. Below, I explain how I read these numbers through seven fundamental metrics.
At a glance
- Revenue of US$54.23 billion (+379% year on year; +30.8% quarter on quarter)
- Adjusted gross margin of 87.0%, against 45.7% a year earlier
- Operating cash flow of US$43.97 billion, 1.17 times GAAP net income
- Weak spot: little returned to shareholders; cash is being reinvested
Why I combine technical and fundamental analysis
Technical analysis shows trend, relative strength and volatility. Fundamental analysis assesses capital efficiency, earnings quality and the ability to reward shareholders. Combining the two gives decisions more substance.
Seven metrics help me organise that work. The figures below are quarterly, not annualised, and calculated on equity and assets at the start of the quarter.
Micron’s 7 fundamental metrics
1. ROE — Return on equity: 37.4%
GAAP net income of US$37.70 billion on US$100.72 billion of shareholders’ equity: 37.4% for the quarter.
2. ROA — Return on assets: 28.1%
The same profit on US$134.11 billion of assets: 28.1%. It shows how much profit the fabs, equipment and other resources generate.
3. EARN — Earnings per share: +33.2%
Diluted GAAP EPS rose from US$24.67 to US$32.87: up 33.2% quarter on quarter.
4. APE — Operating profitability on equity
Revenue minus cost of goods sold, overheads and interest, relative to shareholders’ equity. It complements ROE with a reading closer to day-to-day operations.
5. CPA — Cash-based operating profitability
It strips out the part of profit that has not yet turned into cash. Micron was strong here: US$43.97 billion of operating cash flow, 1.17 times GAAP net income, and US$33.20 billion of adjusted free cash flow.
6. GPA — Gross profit to assets: 35.1%
US$47.05 billion of gross profit on US$134.11 billion of assets: 35.1%. Gross margin uses revenue as the denominator; GPA measures how productive the assets are.
7. NPY — Net payout yield
Dividends plus buybacks, net of share issuance, relative to market capitalisation. This is the weakest metric: over the fiscal year, Micron paid US$0.61 billion in dividends and bought back US$0.65 billion of shares — small amounts for a company of its size. Cash is being reinvested in the business rather than returned.
| Metric | What it measures | Micron, fiscal Q4 2026 |
|---|---|---|
| ROE | Profit on shareholders’ equity | 37.4% |
| ROA | Profit on assets | 28.1% |
| EARN | Change in diluted EPS | +33.2% quarter on quarter |
| APE | Operating profit on equity | not calculated in this article |
| CPA | Cash-based profitability | operating cash flow = 1.17× net income |
| GPA | Gross profit on assets | 35.1% |
| NPY | Net payout to shareholders | low: cash reinvested |
Beyond one quarter: the trend is what counts
More than a single quarter’s figure, what matters is how it evolves over several. I look for sustained economic improvement, cross-checked against the price trend.
My reading is constructive. Adjusted gross margin reached 87.0%, against 45.7% a year earlier, and profit came with strong cash generation.
Micron’s guidance for next quarter
There is one point to watch. Management guides to US$61.5 billion of revenue next quarter (midpoint): still growth, but roughly +13% sequentially, less than half this quarter’s +30.8%. Guided adjusted gross margin eases to 86.25%. These are management expectations, not results.
My focus is on the productivity of new investment, margins and earnings per share. Those are what separate a very favourable phase of the cycle from a lasting improvement in the business. A sharper slowdown than guided, or margins giving way, would weaken this reading.
What this means for Santiago1000 copiers
If you already copy Santiago1000, this is the logic behind the positions. If you are new here, following these analyses and checking the portfolio’s results and risk lets you get to know the process before deciding to copy.
Thank you for your trust.
Santiago
Source: Micron earnings release, 30 September 2026.
I hold a position in $MU. Educational content, not personalised financial advice. Your capital is at risk. Past performance is not a guarantee of future results.

