
Europe, the United States and China link savings, investment and consumption in a network that can generate prosperity — but can also build up fragilities. The outcome depends on how capital is used and how the gains are shared.
By Antonio Santiago | Santiago1000 · 9 October 2026
A European invests in a fund of US shares. An American company expands its technology capacity. A Chinese manufacturer supplies the equipment. At first glance, this is a simple sequence: savings, financing and production.
In practice, these transactions pass through banks, funds, currencies, governments and supply chains. Money does not travel around a closed triangle. Europe, the United States and China all save, invest, produce and consume; they do so in different proportions and with links to the rest of the world.
My reading is that this integration can increase global prosperity. Its weak point appears when the growth of financial obligations and asset prices outpaces the capacity to generate income, or when the gains are concentrated while the costs fall on groups with little ability to adapt.
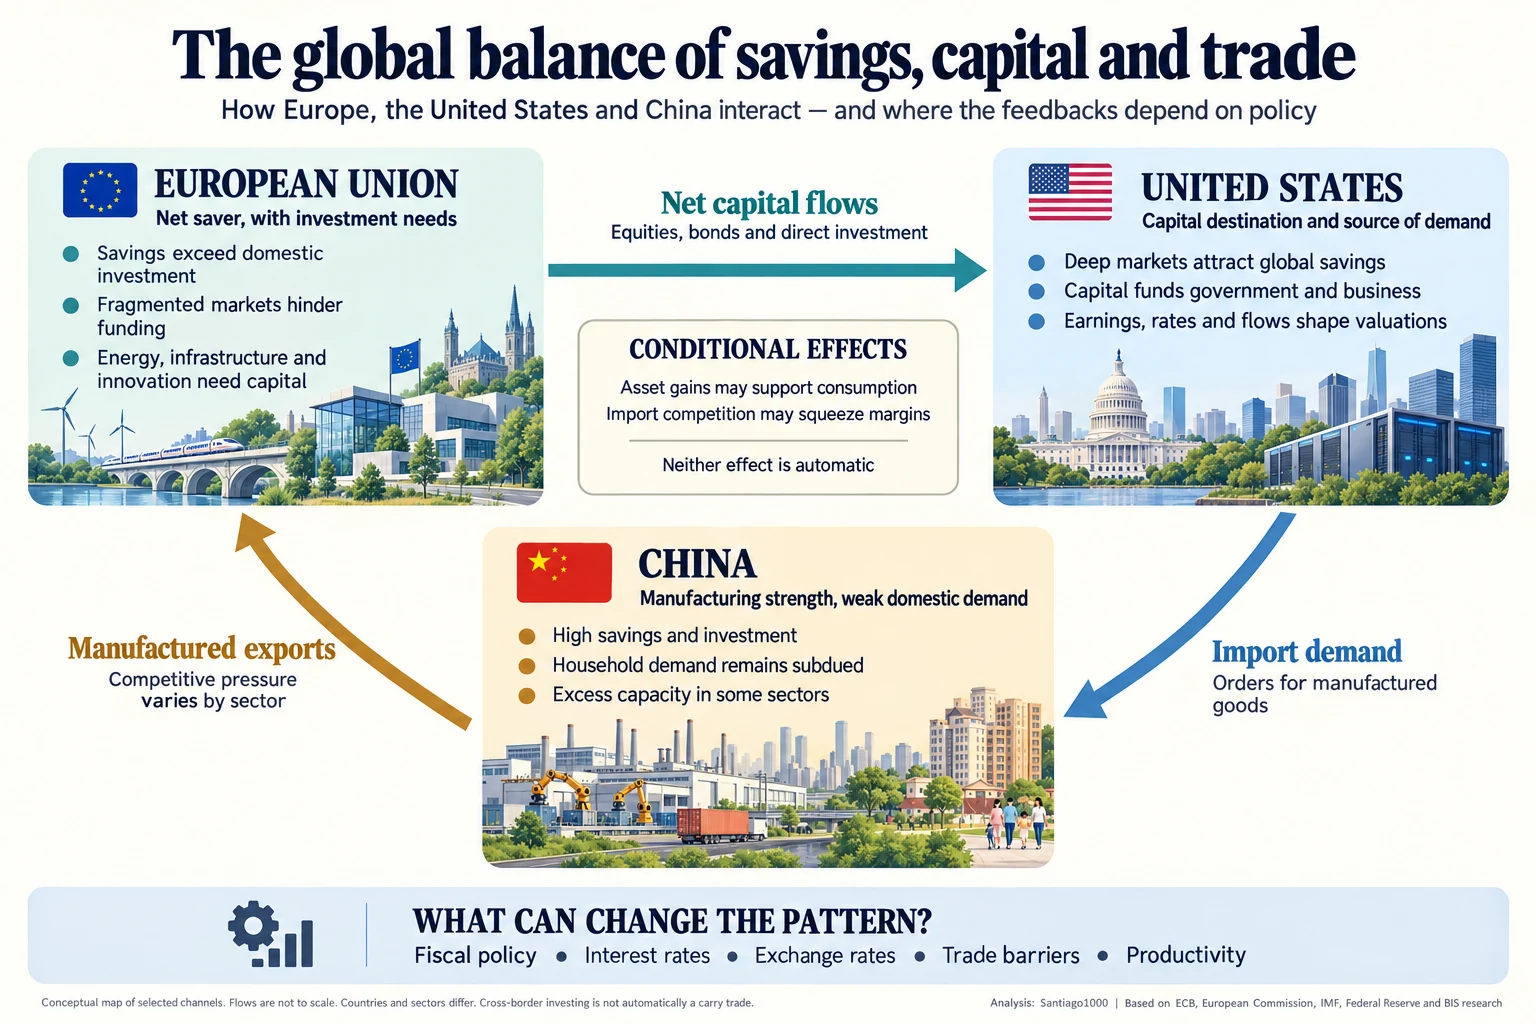
Selected channels of economic interaction. Arrows are not to scale and do not represent a closed loop or inevitable causal relationships.
What the map shows — and what it does not prove
The infographic accompanying this article shows selected channels, without representing the size of the flows. The arrow from the United States to China indicates import demand; the corresponding goods travel in the opposite direction. Nor does the Europe–US financial link mean that all European savings end up there.
There is a useful accounting relationship:
Current account balance = national saving − domestic investment
National saving includes both the public and private sectors. The current account covers goods, services, and income and transfers with the rest of the world; it is not limited to trade in merchandise.
A deficit can go hand in hand with productive investment or with insufficient saving. A surplus can reflect preparation for an ageing population or domestic opportunities left untapped. The accounting identity does not establish what the original cause was, nor does it allow a country to be labelled a winner or a loser automatically. [1]
What we know about these three poles
The European Commission’s 2026 European Macroeconomic Report describes an EU that places savings abroad and a United States that needs foreign savings to fund itself, and links this pattern to the fragmentation of European capital markets. In February, ECB President Christine Lagarde acknowledged the contrast between exporting savings and facing substantial investment needs at home. That does not make a saver’s decision irrational: a project can be necessary for society without yet offering an accessible and attractive investment. [2][3]
Even so, the idea of a “flight” of savings should not be overstated. Much of Europe’s savings remains in bank deposits, with a strong home bias. In 2025, the euro area’s net portfolio investment flows were actually inward, and the rise in US shares held by Europeans is explained mainly by the appreciation of those shares, not by new money. [9]
In China, the IMF points to weak domestic demand, vulnerabilities linked to debt and property, and excess supply in some sectors. The diagnosis does not apply across the board to all of Chinese industry: technological competitiveness and overcapacity can coexist in different activities. [4]
The IMF’s External Sector Report, published in July 2026 using 2025 data, identifies a renewed widening of global imbalances, with China and the United States as the main drivers of the excess, and concludes that simultaneous action on domestic imbalances produces the best outcome for the world economy. It is a diagnosis of vulnerabilities, not a forecast of collapse. [5]
When capital finances prosperity
The most important benefit arises when savings find projects with an economic return: better power grids, efficient transport, research, useful software, or equipment that allows more to be produced with the same resources.
External financing can bring these investments forward. Those who provide capital share in the results and diversify their wealth; those who receive it can finance projects without relying solely on local savings. Buying foreign assets also reduces a household’s dependence on the country where its job, home and other income are already concentrated.
We do, however, need to distinguish between transactions. When shares or bonds are issued, the company receives financing. When an existing security is bought, the payment usually goes to another investor. Secondary-market trading contributes to liquidity and price discovery, but it does not automatically mean new money going into a factory.
Trade adds another source of benefits. Competitive equipment and components can lower costs and make projects viable. Households can buy more with the same income; companies that use imported components can improve margins or cut prices. These gains depend on competition, quality and whether the savings are passed on to the customer.
Who benefits — and who may bear the cost
An economy is not a single agent. Within the same country, a consumer, an industrial worker, a shareholder and a taxpayer can have opposite experiences.
| Group | Possible benefit | Cost or risk |
|---|---|---|
| European savers | Diversification and a stake in global companies | Currency and market losses, and concentration |
| European companies using imports | More affordable equipment and components | Dependence on foreign suppliers |
| Manufacturers exposed to competition | Incentive to innovate and improve efficiency | Pressure on margins, jobs and capacity |
| US companies and government | Greater access to financing | Sensitivity to the cost of capital and to confidence |
| Chinese exporters and workers | Orders, scale and jobs | Dependence on external demand and trade barriers |
| Consumer households | Greater choice and competitive prices | Consumption gains can coexist with job insecurity |
This table sets out possible mechanisms, not a measurement of current outcomes. The same person can occupy several positions: benefiting from cheap imports, owning shares that have risen in value and working for a company under competitive pressure.
The costs that low prices can hide
The first is opportunity cost. If a region keeps poor infrastructure and companies struggle to obtain financing, the returns earned abroad can coexist with weak domestic momentum. The answer lies in making domestic projects deliverable and attractive, while preserving investors’ freedom to diversify.
The second is the cost of adjustment. The benefits of trade can be spread across millions of consumers, while job losses are concentrated in a single town or profession. Training, mobility, competition and social protection shape how well aggregate gains translate into better lives.
The third is strategic dependence. A highly efficient supplier can become a point of fragility during a logistics disruption or a geopolitical dispute. Redundancy, inventories and alternative suppliers have a cost, but they can work as insurance.
Finally, there is the cost of maintaining capacity without a sufficient return. A factory in operation does not prove that the investment creates value. If revenues do not pay for capital, labour and debt sustainably, the loss may fall on shareholders, creditors or, in some cases, taxpayers.
Financial appreciation does not guarantee sustainable income
Capital inflows can support financing and asset prices. But expected profits, interest rates and risk premiums also weigh on valuations.
Higher wealth can support consumption. That effect is uneven: research published by the Federal Reserve in 2025 links greater wealth concentration to a lower aggregate propensity to consume out of wealth gains. A rising stock market does not pass through evenly to the economy. [6]
The risk emerges if households, companies or governments take on commitments that only look affordable with cheap financing and continuous appreciation. A correction can then interact with debt, collateral and refinancing needs.
The exchange rate adds another layer. In a hypothetical example, with no costs and no currency hedging, an asset that rises 10% in dollars and a dollar that loses 10% against the euro produce a return of about −1% in euros: 1.10 × 0.90 − 1. The quality of the asset and the currency in which the result is measured are separate questions.
Nor should every international investment be called a carry trade. The mechanism involves borrowing in a lower-yielding currency and taking exposure to assets in another currency, seeking to capture an interest-rate differential. Leverage can make the reversal more abrupt. [7]
Three scenarios: what can go right, and for whom
The following scenarios are conditional interpretations, with no probabilities assigned.
1. Productive rebalancing. Europe improves financing and project delivery; the US combines innovation with greater fiscal sustainability; China strengthens household income and consumption. Global demand comes to rest on a broader base. Workers, infrastructure suppliers, productive companies and consumers could benefit. Some producers dependent on subsidies or on redundant capacity would face losses during the transition.
2. Growth with concentrated gains. Investment and technology deliver results, but a large share of the additional income goes to owners of capital and dominant companies. The economy grows without a proportional improvement for everyone. Shareholders and professionals in scarce fields may benefit most; groups exposed to competition or without assets may fall behind. Distributional tension becomes a political risk to the continuity of the model itself.
3. Disorderly adjustment. A combination of high interest rates, disappointing returns and trade conflict triggers a simultaneous reassessment of investment and financing. Indebted companies cut spending, suppliers lose orders and exporters face weaker demand. Strong balance sheets and liquidity help to withstand the shock, but they do not guarantee immunity. Geographical diversification offers little protection if every position depends on the same economic cycle.
The speed and sequencing of policy matter. If the US reduces demand before other economies strengthen theirs, the adjustment could weigh on global growth. The IMF considers that simultaneous measures on domestic imbalances deliver more favourable results. [5]
Tariffs and repatriation do not solve everything
Tariffs can shift suppliers and protect specific activities, but their costs can hit consumers and companies that use imported goods. In IMF simulations published in 2025, higher barriers had limited effects on aggregate external imbalances, because they reduce both investment and saving in the country that imposes them. That does not mean the sectoral effects are small. [8]
Likewise, forcing capital to stay at home does not create profitable projects. A lasting improvement requires the conditions to invest: predictability, energy, skills, competition, financing and delivery.
What this means for my portfolio
This reading does not change the portfolio overnight, but it helps explain how it is built. On 8 October, around three quarters of the portfolio was in US companies and ETFs, close to 13% in European assets, and there was no direct exposure to China. These figures refer to domicile and listing, not to where revenues come from: many of the US companies sell to and buy from Asia.
- Currency. The portfolio is in dollars. For anyone measuring results in euros, the currency example above applies directly.
- Concentration. The third scenario is the one I watch most closely. A meaningful part of the portfolio depends on the same technology and infrastructure investment cycle, and diversifying by country helps little if the engine is the same.
- Europe. I keep European exposure for diversification and out of conviction in specific companies, knowing that the euro area has been going through a slowdown.
What would make me revisit this view: a persistent rise in the cost of financing without a matching improvement in results, or signs that technology investment has stopped generating cash.
What I would watch
To judge whether these flows are building sustainable capacity, I would watch productivity, return on capital and cash generation; the path of household income and consumption; and the costs of financing and refinancing.
In Europe, what matters is the delivery of investment and companies’ access to capital. In the US, the quality of investment and the fiscal trajectory. In China, the balance between domestic demand, production, prices and debt. In all three cases, the question is whether the gains reach more people or whether it is mainly asset valuations that grow.
I am in favour of the free movement of capital and of trade when they expand opportunities and productive capacity. My optimism depends on the quality of projects, the strength of balance sheets and the capacity to absorb change. The best global outcome would be to turn savings into productivity, productivity into income, and income into more balanced demand.
Antonio Santiago | Santiago1000
Disclosure: I invest in US and European shares and ETFs through my public portfolio on eToro. This article is for information only and is not investment advice. Your capital is at risk, and past performance does not guarantee future results.
Sources
The diagnoses attributed to institutions are based on the sources below. The examples, the table of beneficiaries and the scenarios are the author’s analysis. The infographic is conceptual and does not represent all international flows.
- IMF — Current Account Deficits (Finance & Development, Back to Basics series)
- European Commission — 2026 European Macroeconomic Report, 25 November 2025
- Christine Lagarde (ECB) — Turning size into scale: Europe’s new growth model, speech, 23 February 2026
- IMF — 2025 Article IV Consultation with China, concluded February 2026
- IMF — 2026 External Sector Report: Amid Rising Imbalances, the Case for Rebalancing, July 2026
- Federal Reserve — Wealth Heterogeneity and Consumer Spending (FEDS Notes), 5 August 2025
- BIS — Sizing up carry trades in BIS statistics (BIS Quarterly Review), September 2024
- IMF — Global Current Account Balances Widen, Reversing Narrowing Trend, 22 July 2025
- Olivier Garnier (Institut Montaigne) — Europe Suffers Not So Much from a ‘Flight’ of Savings as from Insufficient Allocation to Equities, 12 May 2026
Acompanha a carteira em tempo real
Todas as posições e pesos do modelo estão visíveis no meu perfil público na eToro.
Ver o perfil @Santiago1000 →Link de afiliado: se abrires conta através dele, posso receber uma comissão da eToro, sem custo para ti. Não é recomendação de investimento. O teu capital está em risco.Follow the portfolio in real time
Every position and weight in the model is visible on my public eToro profile.
View the @Santiago1000 profile →Affiliate link: if you open an account through it, I may receive a commission from eToro at no cost to you. Not investment advice. Your capital is at risk.Segui il portafoglio in tempo reale
Tutte le posizioni e i pesi del modello sono visibili sul mio profilo pubblico eToro.
Vedi il profilo @Santiago1000 →Link di affiliazione: se apri un conto tramite questo link, potrei ricevere una commissione da eToro, senza costi per te. Non è una raccomandazione di investimento. Il tuo capitale è a rischio.
