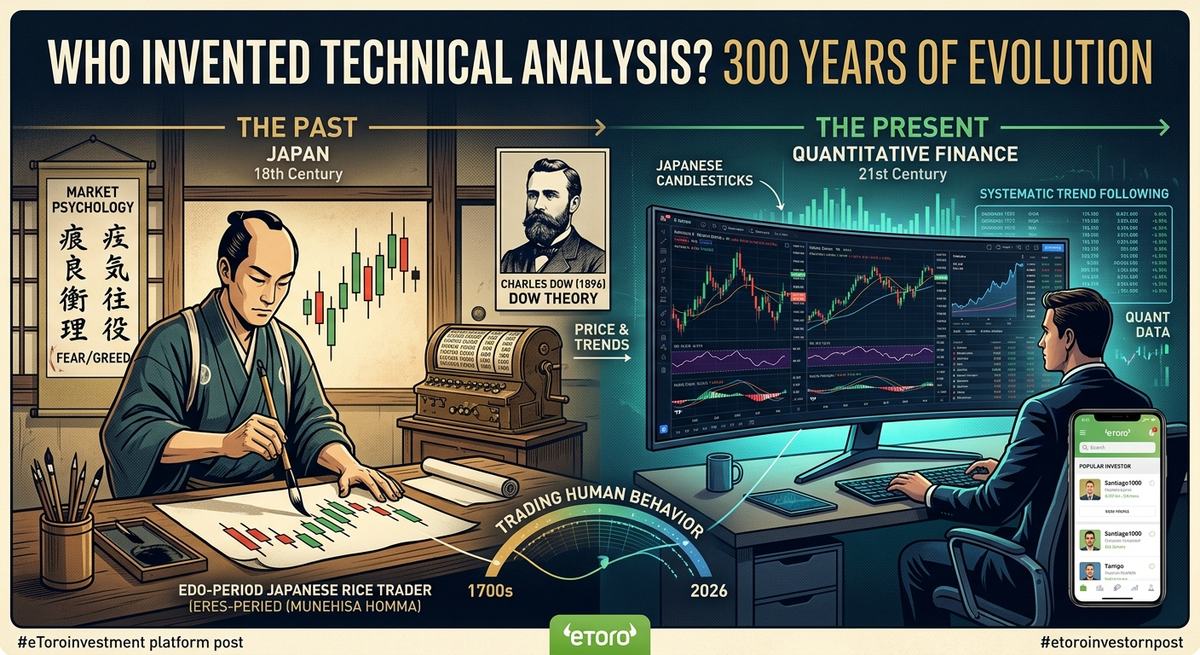
Most of us have opened a stock chart hundreds or thousands of times. Candlesticks. RSI. MACD. Moving averages. Support and resistance. But recently I went back to a much more basic question: who invented technical analysis?
The answer changed the way I think about charts. There was no single inventor. The story begins with Japanese rice traders, passes through Charles Dow and the creation of the Dow Jones Industrial Average, evolves into the chart patterns traders still recognise today, and eventually reaches something institutional quantitative funds continue to study: momentum and trend following.
That is almost 300 years of evolution. Let’s take it in order.
1. Japan, 18th century: psychology enters the market
Munehisa Homma is traditionally associated with the early developments behind Japanese candlestick analysis, in the rice markets of Sakata.
The most interesting part wasn’t the candles themselves.
It was the recognition that the psychology of buyers and sellers affects prices. That sounds obvious today. In the 1700s, it was a powerful insight.
2. Charles Dow: markets have trends
Fast-forward to 1896. Charles Dow created the Dow Jones Industrial Average. Initial level: 40.94 points. In February 2026, the index crossed 50,000 for the first time.
But Dow’s lasting contribution wasn’t the index itself. It was understanding that markets don’t simply move randomly from one isolated day to another: they develop larger trends, corrections and shorter-term fluctuations.
3. Charts acquire a language
William Hamilton and Robert Rhea developed what became Dow Theory. Richard Schabacker subsequently systematised trends, support, resistance and chart formations. Edwards & Magee’s 1948 Technical Analysis of Stock Trends then became one of the classic books of the discipline.
This is the stage where technical analysis stopped being intuition and gained a vocabulary of its own.
4. The computer changes technical analysis
Eventually visual patterns became formulas. Welles Wilder created RSI, ATR and ADX. Gerald Appel created MACD. John Bollinger developed Bollinger Bands. Richard Donchian helped pioneer systematic trend following.
The difference is enormous: from this point on, the rules could be programmed and tested. And that leads to my favourite part of the story.
5. Technical analysis meets quantitative finance
A major 2012 academic study analysed 58 liquid futures across equities, bonds, commodities and currencies. It found significant time series momentum: assets that had been rising tended, statistically, to continue rising for a period, while declining assets showed similar persistence.
Research using historical data going back to 1880 has also found remarkably persistent evidence for systematic trend following across very different market environments.
This doesn’t mean every chart pattern works. Far from it. But it tells us something important: price itself can contain information.
Fundamentals or technicals? I prefer to think in layers
This is why I don’t believe investors have to choose between fundamentals and technicals. I prefer thinking about them as different layers of the same decision:
- Fundamentals: what should I own?
- Valuation: what am I paying?
- Momentum: is the market confirming the thesis?
- Risk: what happens if I’m wrong?
That is far more useful to me than trying to predict tomorrow’s candle.
The 300-year irony
Almost three centuries ago, traders were trying to understand trends and market psychology in Japanese rice. Today quantitative funds use enormous datasets and computers to study variations of the same fundamental question: does price behaviour contain information about what comes next?
The mathematics became infinitely more sophisticated. The humans behind the prices didn’t.
The next question
Next, I want to explore a much harder question: does technical analysis actually work — and which parts survive serious statistical testing? That is where things get really interesting.
Investing with method, not with opinion
Santiago1000 newsletter: one edition a week, in Portuguese, on investing with method instead of opinion. Subscribe here.
Scorecard: the scoring model I use to evaluate companies is public at santiago1000.it/pt/scorecard/.
Antonio Santiago | Santiago1000. For educational purposes only. Nothing in this article constitutes investment advice.
Acompanha a carteira em tempo real
Todas as posições e pesos do modelo estão visíveis no meu perfil público na eToro.
Ver o perfil @Santiago1000 →Link de afiliado: se abrires conta através dele, posso receber uma comissão da eToro, sem custo para ti. Não é recomendação de investimento. O teu capital está em risco.Follow the portfolio in real time
Every position and weight in the model is visible on my public eToro profile.
View the @Santiago1000 profile →Affiliate link: if you open an account through it, I may receive a commission from eToro at no cost to you. Not investment advice. Your capital is at risk.Segui il portafoglio in tempo reale
Tutte le posizioni e i pesi del modello sono visibili sul mio profilo pubblico eToro.
Vedi il profilo @Santiago1000 →Link di affiliazione: se apri un conto tramite questo link, potrei ricevere una commissione da eToro, senza costi per te. Non è una raccomandazione di investimento. Il tuo capitale è a rischio.
